CLIENT PORTFOLIO · ANONYMOUS CASE STUDY · CAMBRIDGE, MD
A pricing strategy measured in evidence, not promises
This client remains private. The records below document one property and one period of managed revenue decisions. They are evidence to inspect—not a promise that another property will perform the same way.
100%+
Year-over-year revenue growth reported for the client
63% vs. 31%
Property vs. market occupancy shown over 30 days
The engagement
What was being managed
Rod & Staff Stays owned the recurring pricing and revenue decisions for an existing short-term rental—the layer between automated software, the calendar ahead and the property's position in its market. Occupancy was measured alongside rate quality and total revenue, never treated as the objective by itself.
The owner and property are intentionally anonymous. No location, property type, starting condition, engagement length, or operational changes have been disclosed, so we do not fill those gaps with a story.
What can be shown is the result record: more than 100% year-over-year revenue growth, two monthly revenue figures, and occupancy ahead of the displayed market comparison windows.
Documented results
The complete evidence available for this case study
Each image is presented at a useful reading size with only the figures visible in the supplied record described.
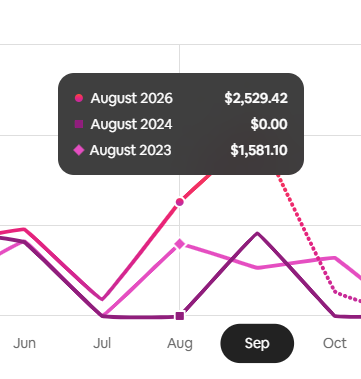
August revenue
$2,529.42 in August 2026 compared to $1,581.10 in August 2023, over 55% YoY revenue lift. *The property was closed for owner use in August 2024 and then operated as a long term rental in August 2025*
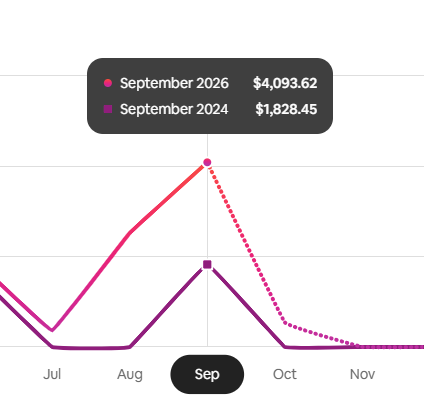
September revenue
$4,093.62 in September 2026 compared to $1,828.45 in September 2024, over 100% YoY revenue lift. *The property was operated as a long term rental in September 2025*
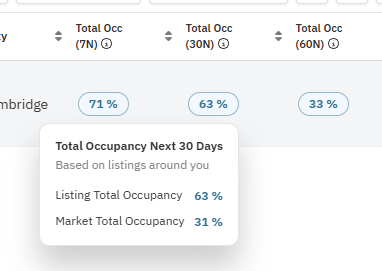
30-day occupancy
63% property occupancy compared with 31% for the market in the displayed period.
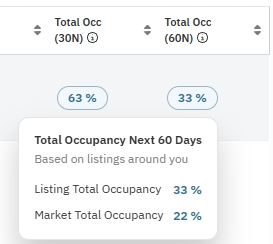
60-day occupancy
33% property occupancy compared with 22% for the market in the displayed period.
How we approach client work
Strategy around the software
These are the decisions in our wider revenue management process. They describe our method, not a claim that any single lever produced the results shown above.
01
Set the position
Read the property against its competitive set before deciding what its rates should communicate.
02
Build the rules
Configure nightly rates, booking windows, minimum stays, discounts, gap nights, and seasonal logic.
03
Watch the pace
Review near-term demand and how the calendar is filling instead of letting software run unattended.
04
Refine with context
Hold, push, or pull back based on the property, the market ahead, and the owner's goals.
Read the evidence carefully
What this case study does—and does not—prove
It documents a strong client result and performance above the market occupancy shown in two forward-looking windows. It gives prospective owners real work to inspect instead of an unsupported promise.
It does not predict another property's outcome. Results vary with the property, market, seasonality, listing quality, demand, owner operations, and implementation. Bookings and revenue are never guaranteed.
The principle remains the same: occupancy tells you what sold, not whether it sold well. Total revenue, rate quality and booking pace have to be read together.
See where your property stands
Get your free pricing audit. We will review your listing, market, competitive set, and current pricing setup.
Get Free Pricing AuditPricing for a similar market? Read the Maryland Airbnb revenue management guide or the Annapolis Airbnb pricing guide.